 |
Remote-sensing techniques are interesting tools to obtain spatially-distributed information on landslide kinematics. They give the possibility to discriminate stable and unstable areas and to map sectors within a landslide with different kinematics.
OMIV is managing a serie of automated cameras SLR (Single Lens Reflex) installed on the landslides, taking pictures at regular time interval (from 1 to 6 hours). Criteria are defined in order to select the images to be processed; these criteria consist mainly of environmental conditions during the acquisition (presence of rain, fog or snow at the surface; complex illumination pattern).
Image Correlation (IC) techniques are then applied, first to align all images in a same block bundle and second to detect the displacements on the image time series.
Principle of Image Correlation
 |
|
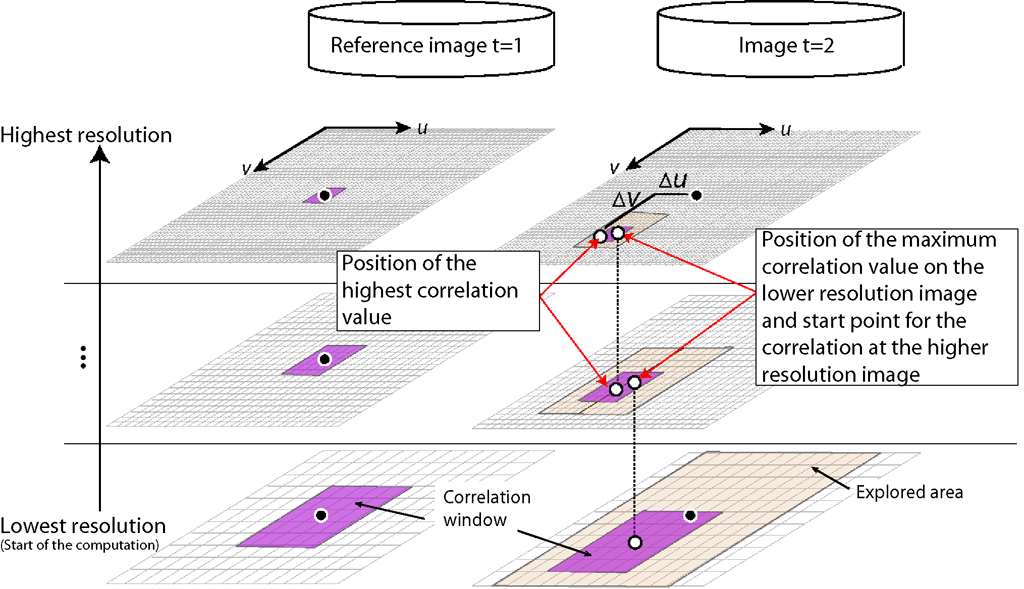
Principle of a normalized hierarchical image correlation technique (Travelletti et al., 2012) |
Using matching techniques, two-dimensional displacement fields can be derived by tracking objects in image pairs acquired at different time. The technique is based on the automatic identification of identical texture patterns within an image by maximizing a correlation function.
A sub-pixel hierarchical correlation technique is used (Hild, 2003). The original images are first converted in gray-scale images on which a 3x3 pixel Sobel convolution matrix is applied to highlight the ground surface texture. The gradient values are then correlated. Four successive degradations of the image resolution are applied following a pyramidal approach for changing the physical size of the correlation window and of the explored area by down-sampling the gradient values of the full resolution image (Kumar & Banerjee, 1998).
The correlation starts with the lowest resolution image in order to determine the largest displacements. Then the location of the pixel with the maximum cross-correlation value is used as the centre of the zone of interest for the next correlation step at a higher resolution. The spatial location of the maximum correlation value in the highest resolution image is thus progressively estimated at higher precision. Ignoring high resolution information at the first computational step decreases the probability to reach a local minimum of the correlation function and, consequently, to obtain a wrong matching in the correspondence solution. This approach is very stable as it offers a high probability of detecting a reliable correlation peak.
Sub-pixel displacements are computed after the correlation at the highest resolution image. An iterative procedure is used to find the maxima of the correlation function interpolated with a bi-parabolic formula and with a maximization procedure based on the simplex method (Press et al., 1997).
The correlation results consist in matrices of displacement ∆u and ∆v along the u- and v-axes in the image plane with their associated correlation index.
In case of terrestrial images, the pixel size is not constant in the image due to the oblique acquisition; the displacements field correlated in the image plane cannot be directly interpreted in terms of metric displacements and ortho-rectification procedures (using available surface models) are applied.
Detection of displacements in space and time
 |
|
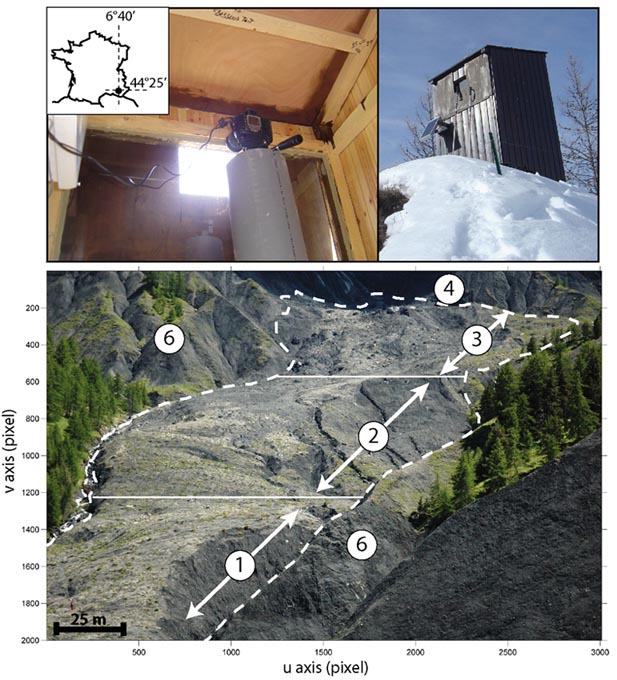
Monitoring system with a very-high resolution camera installed a the front of the Super-Sauze landslide on a stable crest. Top: Monitoring system. Bottom: Image acquired by the monitoring system presenting the different parts of the landslide from the camera location. The numbers refers to: (1): Lower part (toe) of the landslide, (2) Middle part (transition zone), (3) Upper part (ablation zone), (4) Main scarp (1980 m), (5) Front (1734 m), (6) Stable crests. |
A set of images acquired at the Super-Sauze landslide over the period May–July 2008 is used to illustrate the potential of the technique for the characterization of the kinematics during an acceleration period.
The instrumentation consists in low-cost D70 Nikon SLR digital cameras either installed on concrete pillars, either installed on poles anchored in the soil. The acquisition system is controlled by a datalogger and the power is provided by a 40 W solar panel.
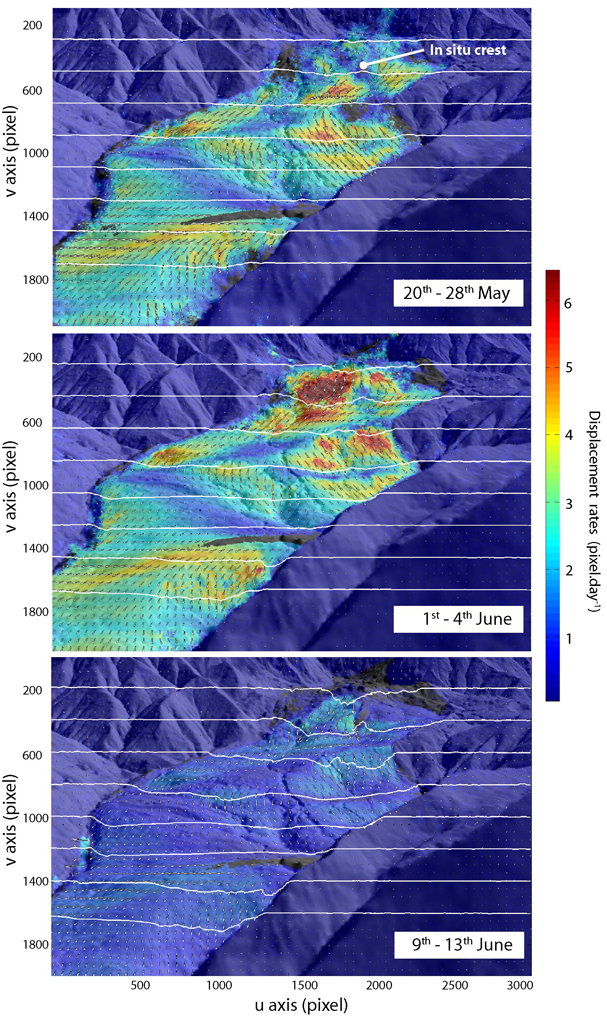
The figure below shows an example of displacement rates (in pixel.day-1) of the ground surface in the image plane derived from image pairs of 20–28 May 2008, 1–4 June 2008 and 9 June–13 June 2008. The contrast in displacement rates between the landslide area and the stable area gives confidence on the calculated velocity field. One can notice that the pattern of displacement rate is heterogeneous spatially and temporally.
The displacement fields computed in the image plane are then orthorectified in a local geographic coordinate system using the collinearity equations (Kraus & Waldhaüsel, 1994). The details of the methodology are explained in Travelletti et al. (2012).
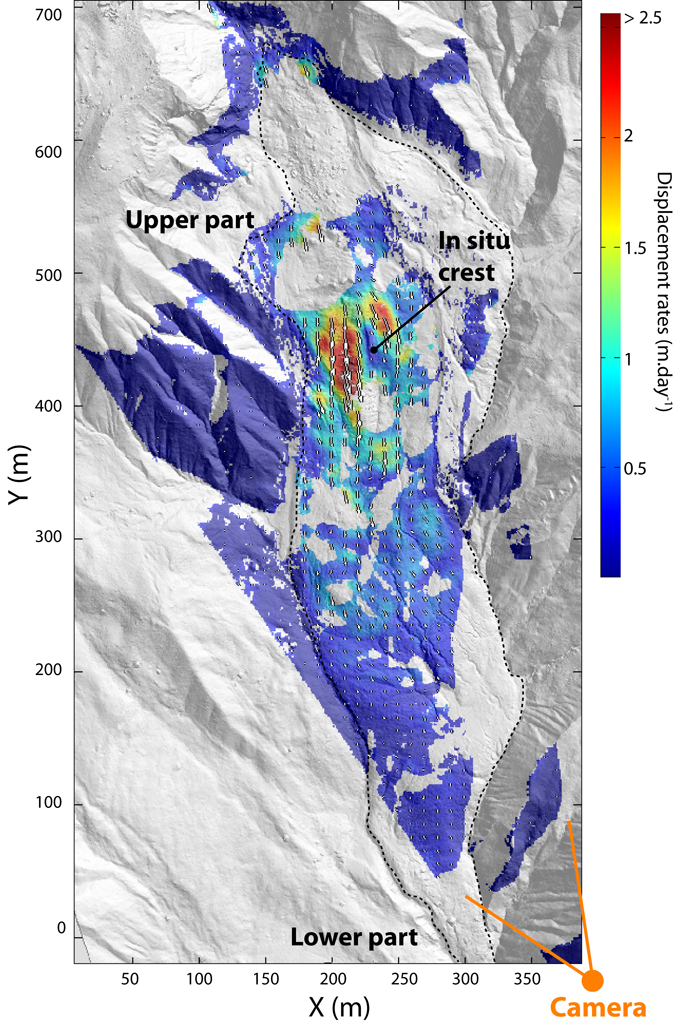
The figure below presents the amplitude of the 3D orthorectified displacement rates for the period 1–4 June. The difference of kinematics between the upper (until 3 m.day-1) and the lower (until 1 m.day-1) parts is important. The geometrical effect induced by the presence of the stable in-situ crest on the landslide kinematics is also clearly pointed out.
The precision of the computed displacements is assessed on stable markers outside of the landslide. Only the points with a correlation coefficient r > 0.8 are taken into account. In the image plane coordinate system, the average error µ ranges from 0.5 to 0.9 pixels with standard deviation σ of 0.3 to 1.2. In the local coordinate system, the average error µ ranges from 0.03 m to 0.11 m with standard deviation σ of 0.10 to 0.31 m.
More information:
Travelletti et al. 2012 -> IJPRS
The performance of the method has been evaluated by comparing the displacements derived from the image correlation, and the displacement monitored by dGPS on several benchmarks. A correlation coefficient of r=0.95 is found on 219 measurements and an average relative accuracy of 20% is determined (Travelletti et al., 2012).
 |
 |
|
Displacement rates amplitude (color) and direction (arrows) in the image plane and cumulated displacements along eight profiles crossing the Super-Sauze landslide over the period 20 May-25 June 2008. In order to highlight the displacement direction, the arrow length is normalized for each image. |
Displacement rate observed at Super-Sauze for the period 1-4 June 2008 in the local geographic coordinate system. |
|
Time-lapse photographs at the Super-Sauze landslide, and characterization of the displacement field. Period: May - June 2008 |